How diverse is the solicitors' profession?
Updated 15 May 2022
This overview of diversity in the solicitors' profession covers solicitors and others working in SRA regulated law firms. It is based on the data we collected from 90% of law firms in 2021 and has been updated to include late submissions collected in 2022.
Use our firm diversity data tool to explore the data for yourself.
The survey of diversity in law firms carried out in 2021 shows a slow but steady increase in diversity among all lawyers since the last survey in 2019. We are including the 'prefer not to say' responses in our analysis this year. This shows a slight decrease across almost all categories, which is encouraging.
- There was an increase in the proportion of women in the profession, and although the seniority gap between female partners and solicitors remains significant, it narrowed slightly.
- There was an increase in the proportion of Black and Asian lawyers, but no change for lawyers from a Mixed/multiple group or Black or Other minority ethnic background. There was a slight decrease for White groups.
- There was an increase in disabled lawyers. However, there is still significant under-representation of disabled lawyers compared to the UK workforce. These were the only two categories where there was a slight increase in those who preferred not to say.
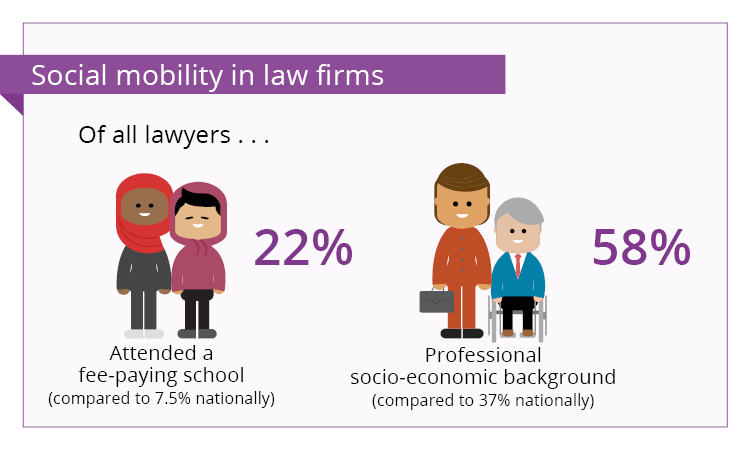
- There is a significant difference in the proportion of lawyers from a 'privileged' background compared to the UK population, based on socio-economic background (determined by parental occupation at aged 14) and attendance at independent/fee-paying schools.
Looking at the differences by firm size highlights significant differences in diversity for the largest law firms (with 50+ partners), compared to the smallest (with one partner), illustrating the real challenges for these large firms in making progress toward diversity.
- Women are underrepresented at partner level in firms of all sizes, but to a greater extent in the largest law firms.
- The difference in the diversity profile between the one-partner firms and the largest firms continues to grow, with the proportion of partners from a Black, Asian and minority ethnic group more than four times greater in one-partner firms.
- The largest law firms have a smaller proportion of disabled lawyers.
- The largest firms have the greatest proportion of lawyers from a professional socio-economic background, and those who went to independent/fee-paying schools.
About the data
We collect diversity data from the law firms we regulate in England and Wales every two years. Our most recent collection was in late summer 2021, when 100% of law firms reported their data to us. This represented information from more than 186,890 people working in 9,667 firms.
In collating their data, firms ask their staff to respond to a standard set of diversity questions and then report their overall information to us. In compiling our results, we present information by distinct groups as shown:
| All working in law firms | ||
|---|---|---|
| All lawyers | Other staff | |
| Partners (Solicitors who are partners, sole practitioners, members or directors in law firms) | Solicitors (All lawyers who are not partners, including solicitors, barristers, chartered legal executives, licensed conveyancers, patent or trademark attorneys, costs lawyers and notaries) | Other staff (Other fee earning roles, roles directly supporting fee earners, managerial roles, IT/HR/other corporate services roles) |
We have set out the key findings for each of the questions asked, including comparisons of the data between firms of different size and work type.
We have changed our approach to reporting data for 2021 by including the 'prefer not to say' data in our analysis. This means that the overall numbers reported last year across all categories will be slightly lower and cannot be compared with the data published in previous years. When we started collecting this data some years ago, we applied recognised modelling techniques to the raw data to predict the outcomes for those who preferred not to say or did not provide a valid response at all.
As part of our commitment to presenting transparent and meaningful information in this important area, and in line with what is now usual practice for many organisations, we have decided that it would be more appropriate to use the raw data and include the 'prefer not to say information', which itself is an important indicator. In this analysis we have drawn any comparison with earlier years based on the raw data for those years.
Key findings by diversity characteristic
We have provided the data broken down by the five main ethnicity categories: Black, Asian, Mixed/Multiple, Other and White. We have also drawn a comparison between those making up the White group, and those making up the Black, Asian, Mixed/Multiple and Other groups which we refer to as the Black, Asian and minority ethnic groups.
All lawyers
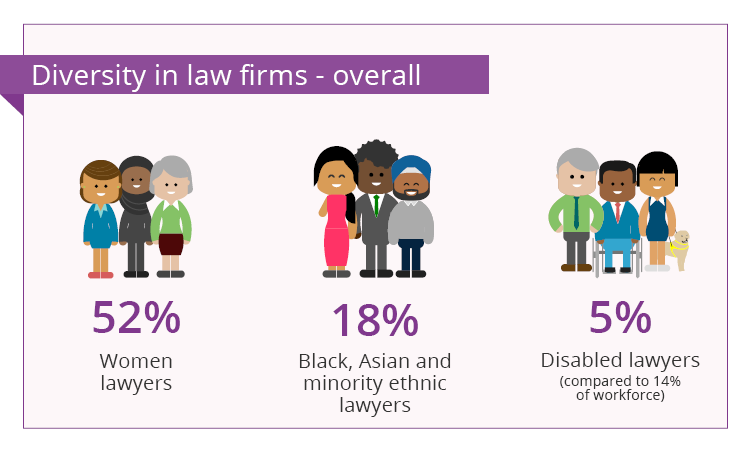
The overall proportion of Black, Asian and minority ethnic lawyers working in law firms is 18% increase from 17% in 2019 and 78% for White groups, down from 79% in 2019. 4% of lawyers preferred not to declare their ethnicity, no change since 2019.
Government employment figures for 2019 showed that 13% of the workforce in England, Scotland and Wales were from a Black, Asian or minority ethnic background and 87% were White. Of the groups making up the Black, Asian and minority ethnic category in relation to the UK workforce:
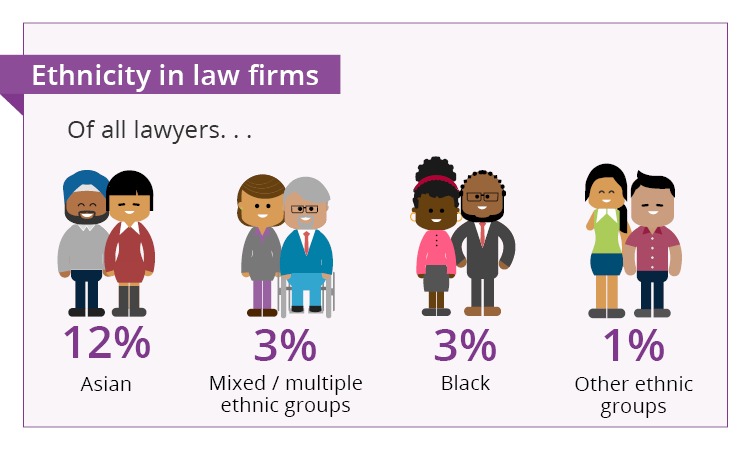
- 12% are Asian compared to 7% of the UK workforce – up from 11% in 2019
- 3% are Black compared to 3% of the UK workforce – up from 2% in 2019
- 3% of are from a Multiple/Mixed background compared to 1% of the UK workforce – up from 2% in 2019
- 1% of lawyers are from other minority groups compared to 2% of the UK workforce – no change since 2019.
By seniority
There is only a small difference by seniority for Black, Asian and minority ethnic lawyers –19% of solicitors and 17% of partners are from this group. Of the groups making up the Black, Asian and minority ethnic category:
- 12% of partners are Asian, compared to 12% of solicitors
- 3% of partners are Black, compared to 3% of solicitors
- 2% of partners are from Mixed/Multiple ethnic backgrounds, compared to 3% of solicitors
- 1% of partners are from other ethnic groups, compared to 1% of solicitors.
A slightly higher proportion of partners preferred not to declare their ethnicity (4%) compared to solicitors (3%).
By firm size
Overall, 17% of partners are from a Black, Asian and minority ethnic background but significant differences become apparent when we look at the breakdown by firm size:
- 7% of partners in the largest firms with 50+ partners and 9% in firms with 10 to 50 partners are from a Black, Asian and minority ethnic background
- 36% of partners in the smallest firms with one partner and 23% of partners in firms with 2 to 5 partners are from a Black, Asian and minority ethnic background.
Of the groups making up the Black, Asian and minority ethnic category:
- 4% of partners in the largest firms with 50+ partners are Asian and 1% are Black and in firms with 10 to 50 partners, 5% are Asian and 1% are Black
- 25% of partners in one partner firms are Asian and 8% are Black and in firms with 2 to 5 partners 18% are Asian and 3% are Black.
The proportion of Black, Asian and minority ethnic partners in one-partner firms has risen from 32% in 2019 to 36% in 2021 and in firms with 50+ partners it has remained the same at 7%.
There is a higher number of people who prefer not to declare their ethnicity in one-partner firms (8%) compared to 2% in 50+ partner firms.
By Work type
There are differences in the proportion of Black, Asian and minority ethnic lawyers according to the type of legal work undertaken by firms. Firms mainly doing criminal work and those mainly doing private client work both have a higher proportion of Black, Asian and minority ethnic lawyers:
- For firms mainly doing private client work, 35% of lawyers are from a Black, Asian or minority ethnic background – 24% are Asian and 8% are Black
- For firms mainly doing criminal law work, 30% of lawyers are from a Black, Asian or minority ethnic background – 21% are Asian and 5% are Black
- For firms mainly doing property law, 19% of lawyers are from a Black, Asian or minority ethnic background – 15% are Asian and 2% are Black
- For firms mainly doing corporate law, 18% of lawyers are from a Black, Asian or minority ethnic background – 10% are Asian and 2% are Black.
- For firms doing a mixed range of work, 13% of lawyers are from a Black, Asian or minority ethnic background – 8% are Asian and 2% are Black.
Other staff
The proportion of other staff working in law firms from a Black, Asian and minority ethnic background is 16%, up from 15% in 2019:
- 9% of other staff are Asian (compared to 7% in the UK workforce) – up from 8% in 2019
- 3% of other staff are Black (compared to 3% in the UK workforce) – no change since 2019
- 3% of other staff are from a Mixed/Multiple ethnic background (compared to 1% in the UK workforce) – up from 2% in 2019
- 1% of other staff are from other ethnic backgrounds (compared to 2% in the UK workforce) – no change since 2019.
There is a slightly lower proportion of other staff who prefer not to declare their ethnicity (3%) compared to 4% for all lawyers.
We asked people to identify their sex, giving people the option to select male or female, but also added the option for people to identify in another way. We appreciate there are strongly held views on these issues and understand the reasons for the latest Census using a binary sex question which requires people to select male or female as per their legal documents. We felt that for us, a more inclusive approach was appropriate, so we provided a third option for this question.
All lawyers
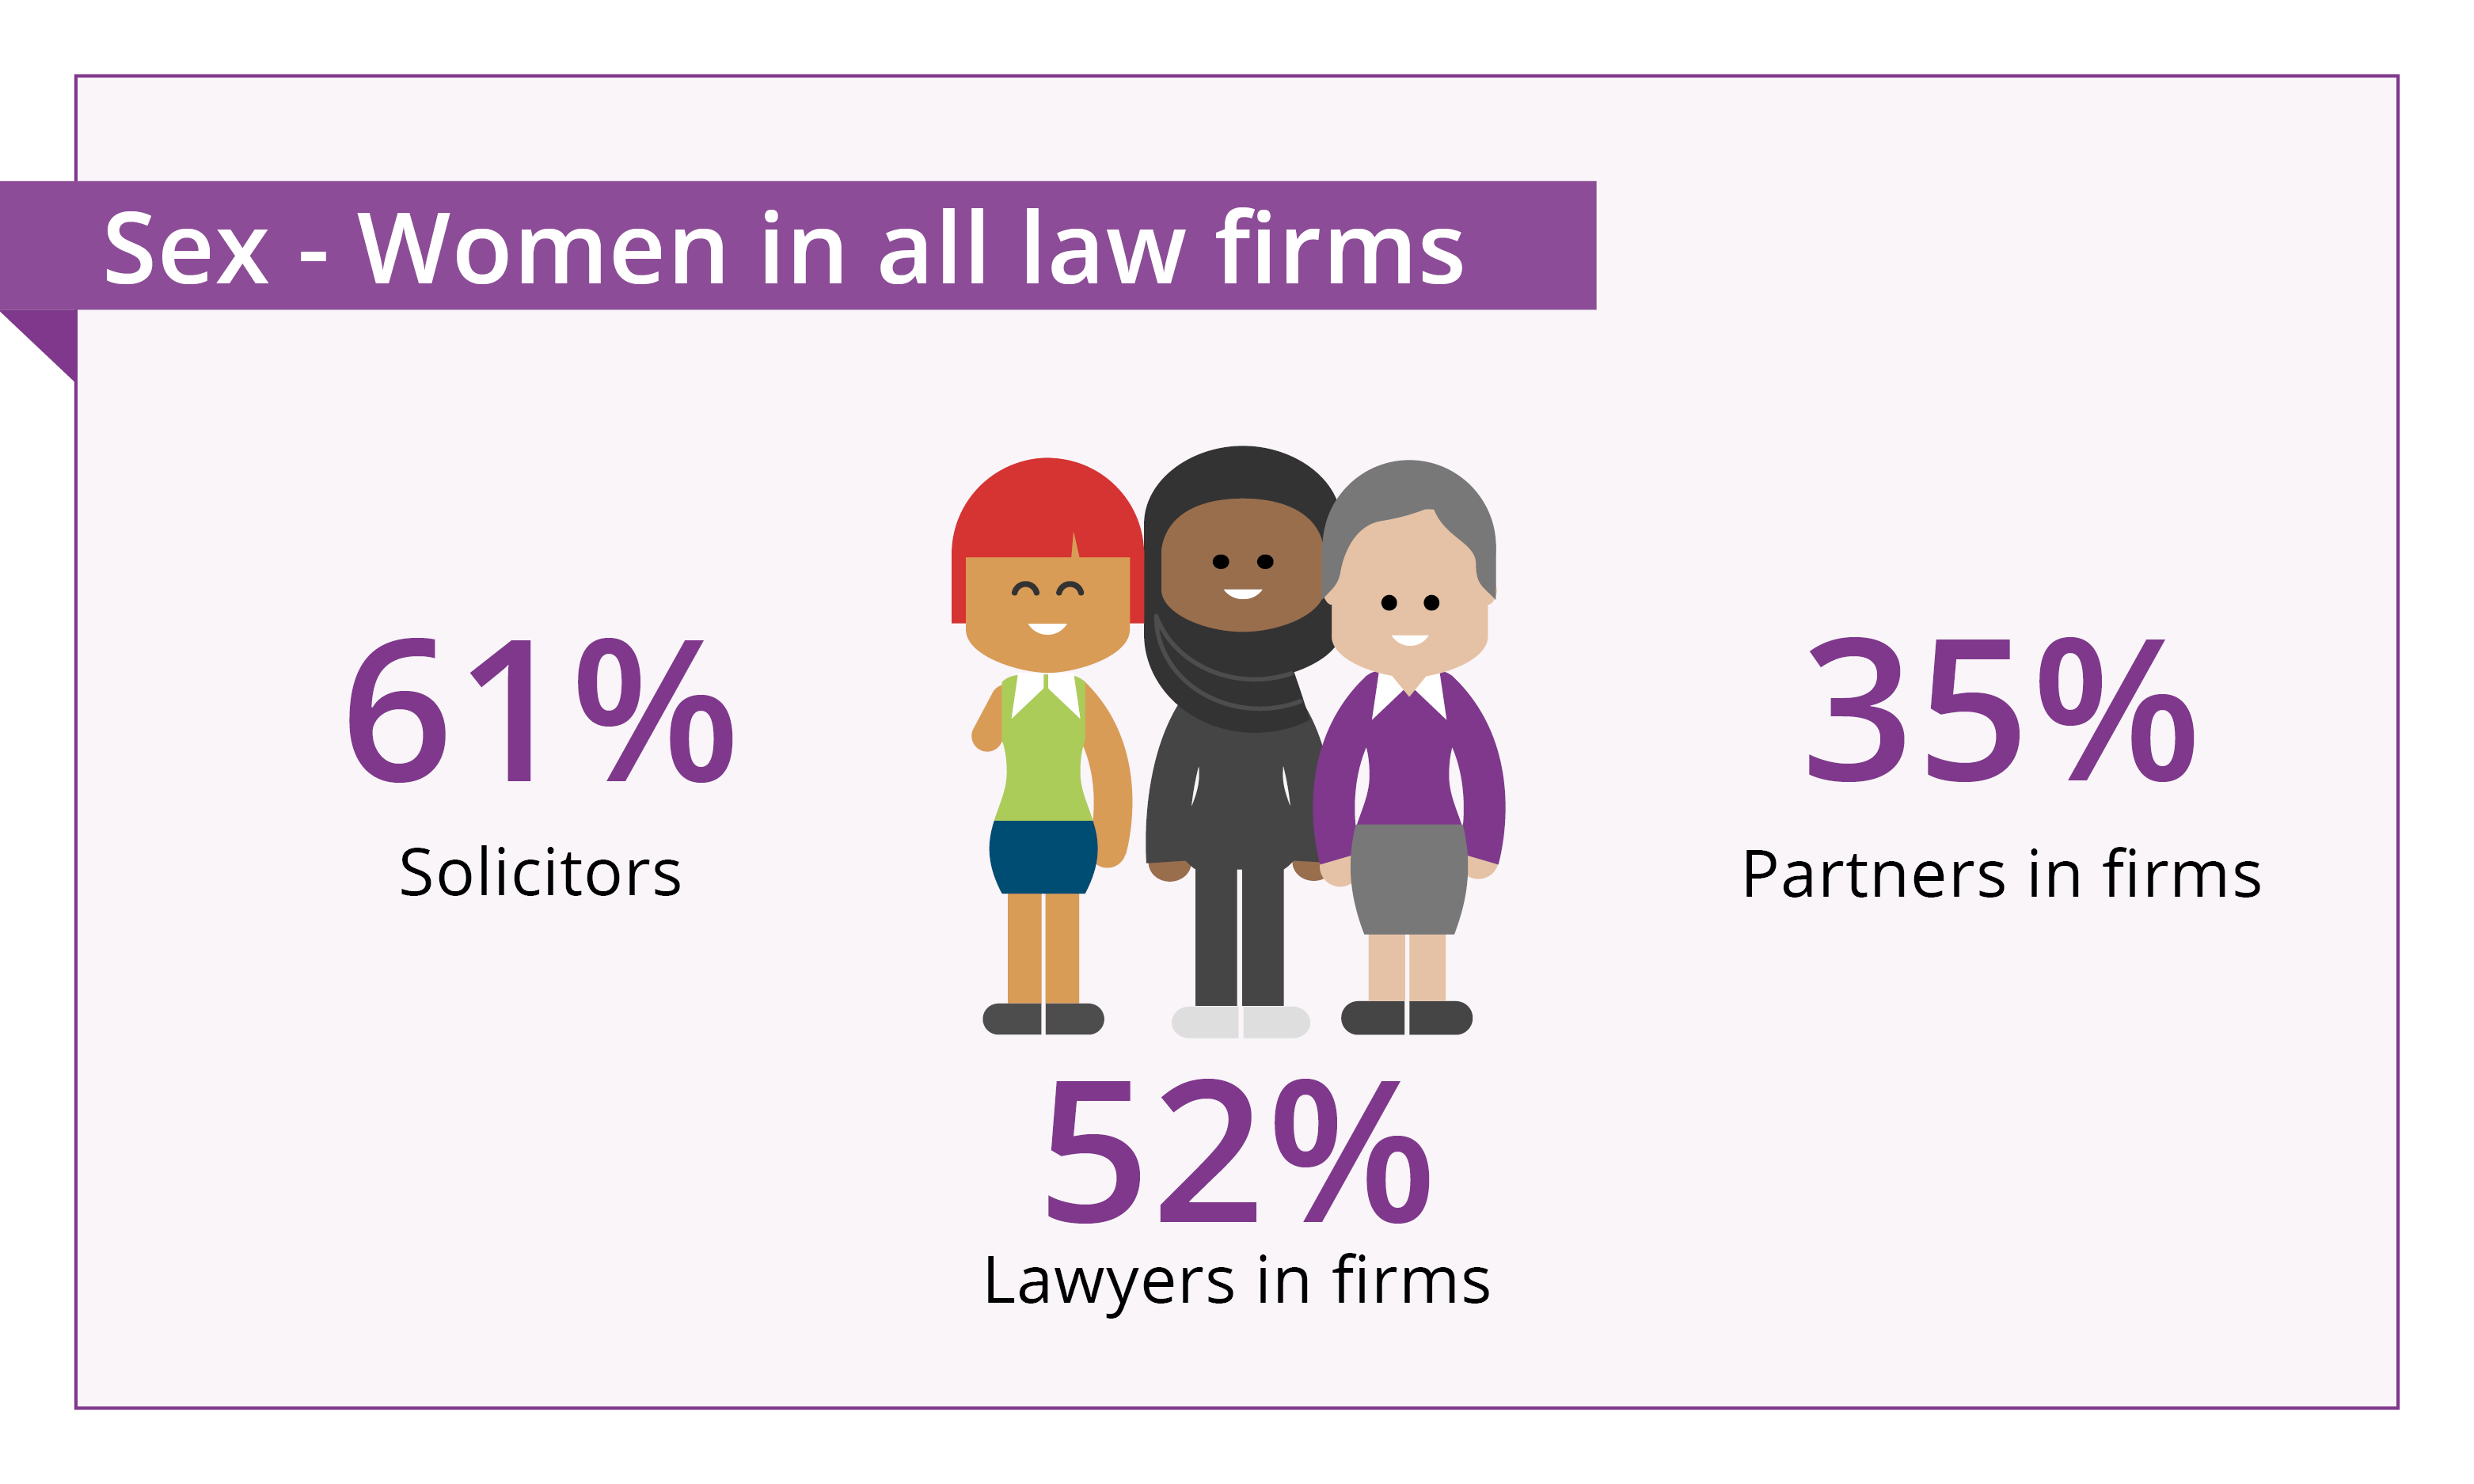
Women make up 52% of lawyers in law firms, up from 51% in 2019. Men made up 47% of lawyers, no change since 2019 and 0.2% preferred another description compared to 0.1% in 2019. Government employment figures for 2019 show that women made up 48% of the workforce in England, Scotland and Wales.
2% of lawyers preferred not to disclose their sex, no change since 2019.
By seniority
Differences become more apparent when we look at seniority, as 61% of solicitors are female compared to 35% of partners. The gap has narrowed since 2019 - although the proportion of female solicitors has not changed, the proportion of female partners has risen from 34% in 2019 to 35% in 2021.
By firm size
There is a greater proportion of female lawyers in mid-size firms. Women make up:
- 52% in firms with 50 plus partners – up from 51% in 2019.
- 56% in firms with 10 to 50 partners – up from 54% in 2019
- 57% of lawyers in firms with 6 to 9 partners – up from 56% in 2019
- 50% in firms with 2 to 5 partners – up from 49% in 2019
- 44% in firms with one partner – up from 43% in 2019.
By work type
Overall, 52% of lawyers are female but this varies by the type of legal work undertaken by the firm. Women are under-represented in some work types including:
- Criminal work, where 38% of lawyers are female – down from 39% in 2019
- Corporate work, where 46% of lawyers are female – up from 45% in 2019
- Property work, where 51% of lawyers are female – up from 49% in 2019.
And women are over-represented in other work types including:
- Private client – where 56% of lawyers are female – up from 55% in 2019
- Mixed work – where 55% of lawyers are female – up from 53% in 2019.
Other staff
For the other staff working in law firms, women make up 74% of the workforce, down from 75% in 2019, compared to 48% of the workforce in England, Scotland and Wales. 0.1% preferred another description (compared to 0.2% in 2019).
We aligned this question to the wording adopted in the 2021 Census, asking people if their gender identity is the same as their sex registered at birth. Because of the small numbers, we have provided the percentages rounded to one decimal point. In the diversity data tool, we are rounding to whole numbers.
All lawyers
The proportion of lawyers who have a gender identity that is different from their sex registered at birth is 0.9 compared to 1.9 in 2019 And 2.8% preferred not to declare their gender identity (down from 3.8% in 2019).
Data on this diversity category was collected for the first time in the 2021 Census, this shows that 0.5%of the general population have a gender identity that is different from their sex registered at birth.
By firm size
Although the numbers are very small, there are some differences by firm size, with 0.5% lawyers in one partner firms who have a gender identity different from their sex registered at birth, compared to 2.4% in firms with 10 to 50 partners.
And 5.5% who prefer not to say in one-partner firms compared to 1.9% in firms with 50+ partners.
By work type
There are small variations when we look at types of legal work with the smallest proportion of lawyers who have a gender identity different from their sex registered at birth working in firms which mainly do criminal work (0.1%) and property work (0.3%).
Other staff
For other staff working in law firms, 0.9% have a gender identity that is different from their sex registered at birth and 1.8% preferred not to say.
We asked if people had a disability in accordance with the definition of disability in the Equality Act and a separate question to asking people to confirm if their day-to-day activities were limited by a health condition or disability. We believe that there is a longstanding and widespread under declaration of disability in the legal sector and we continue to work with others to increase lawyers' confidence in saying they have a disability. As set out below, this was the sole category where we saw a slight increase since 2019 in 'prefer not to say', albeit the trend over the years has been more positive.
All lawyers
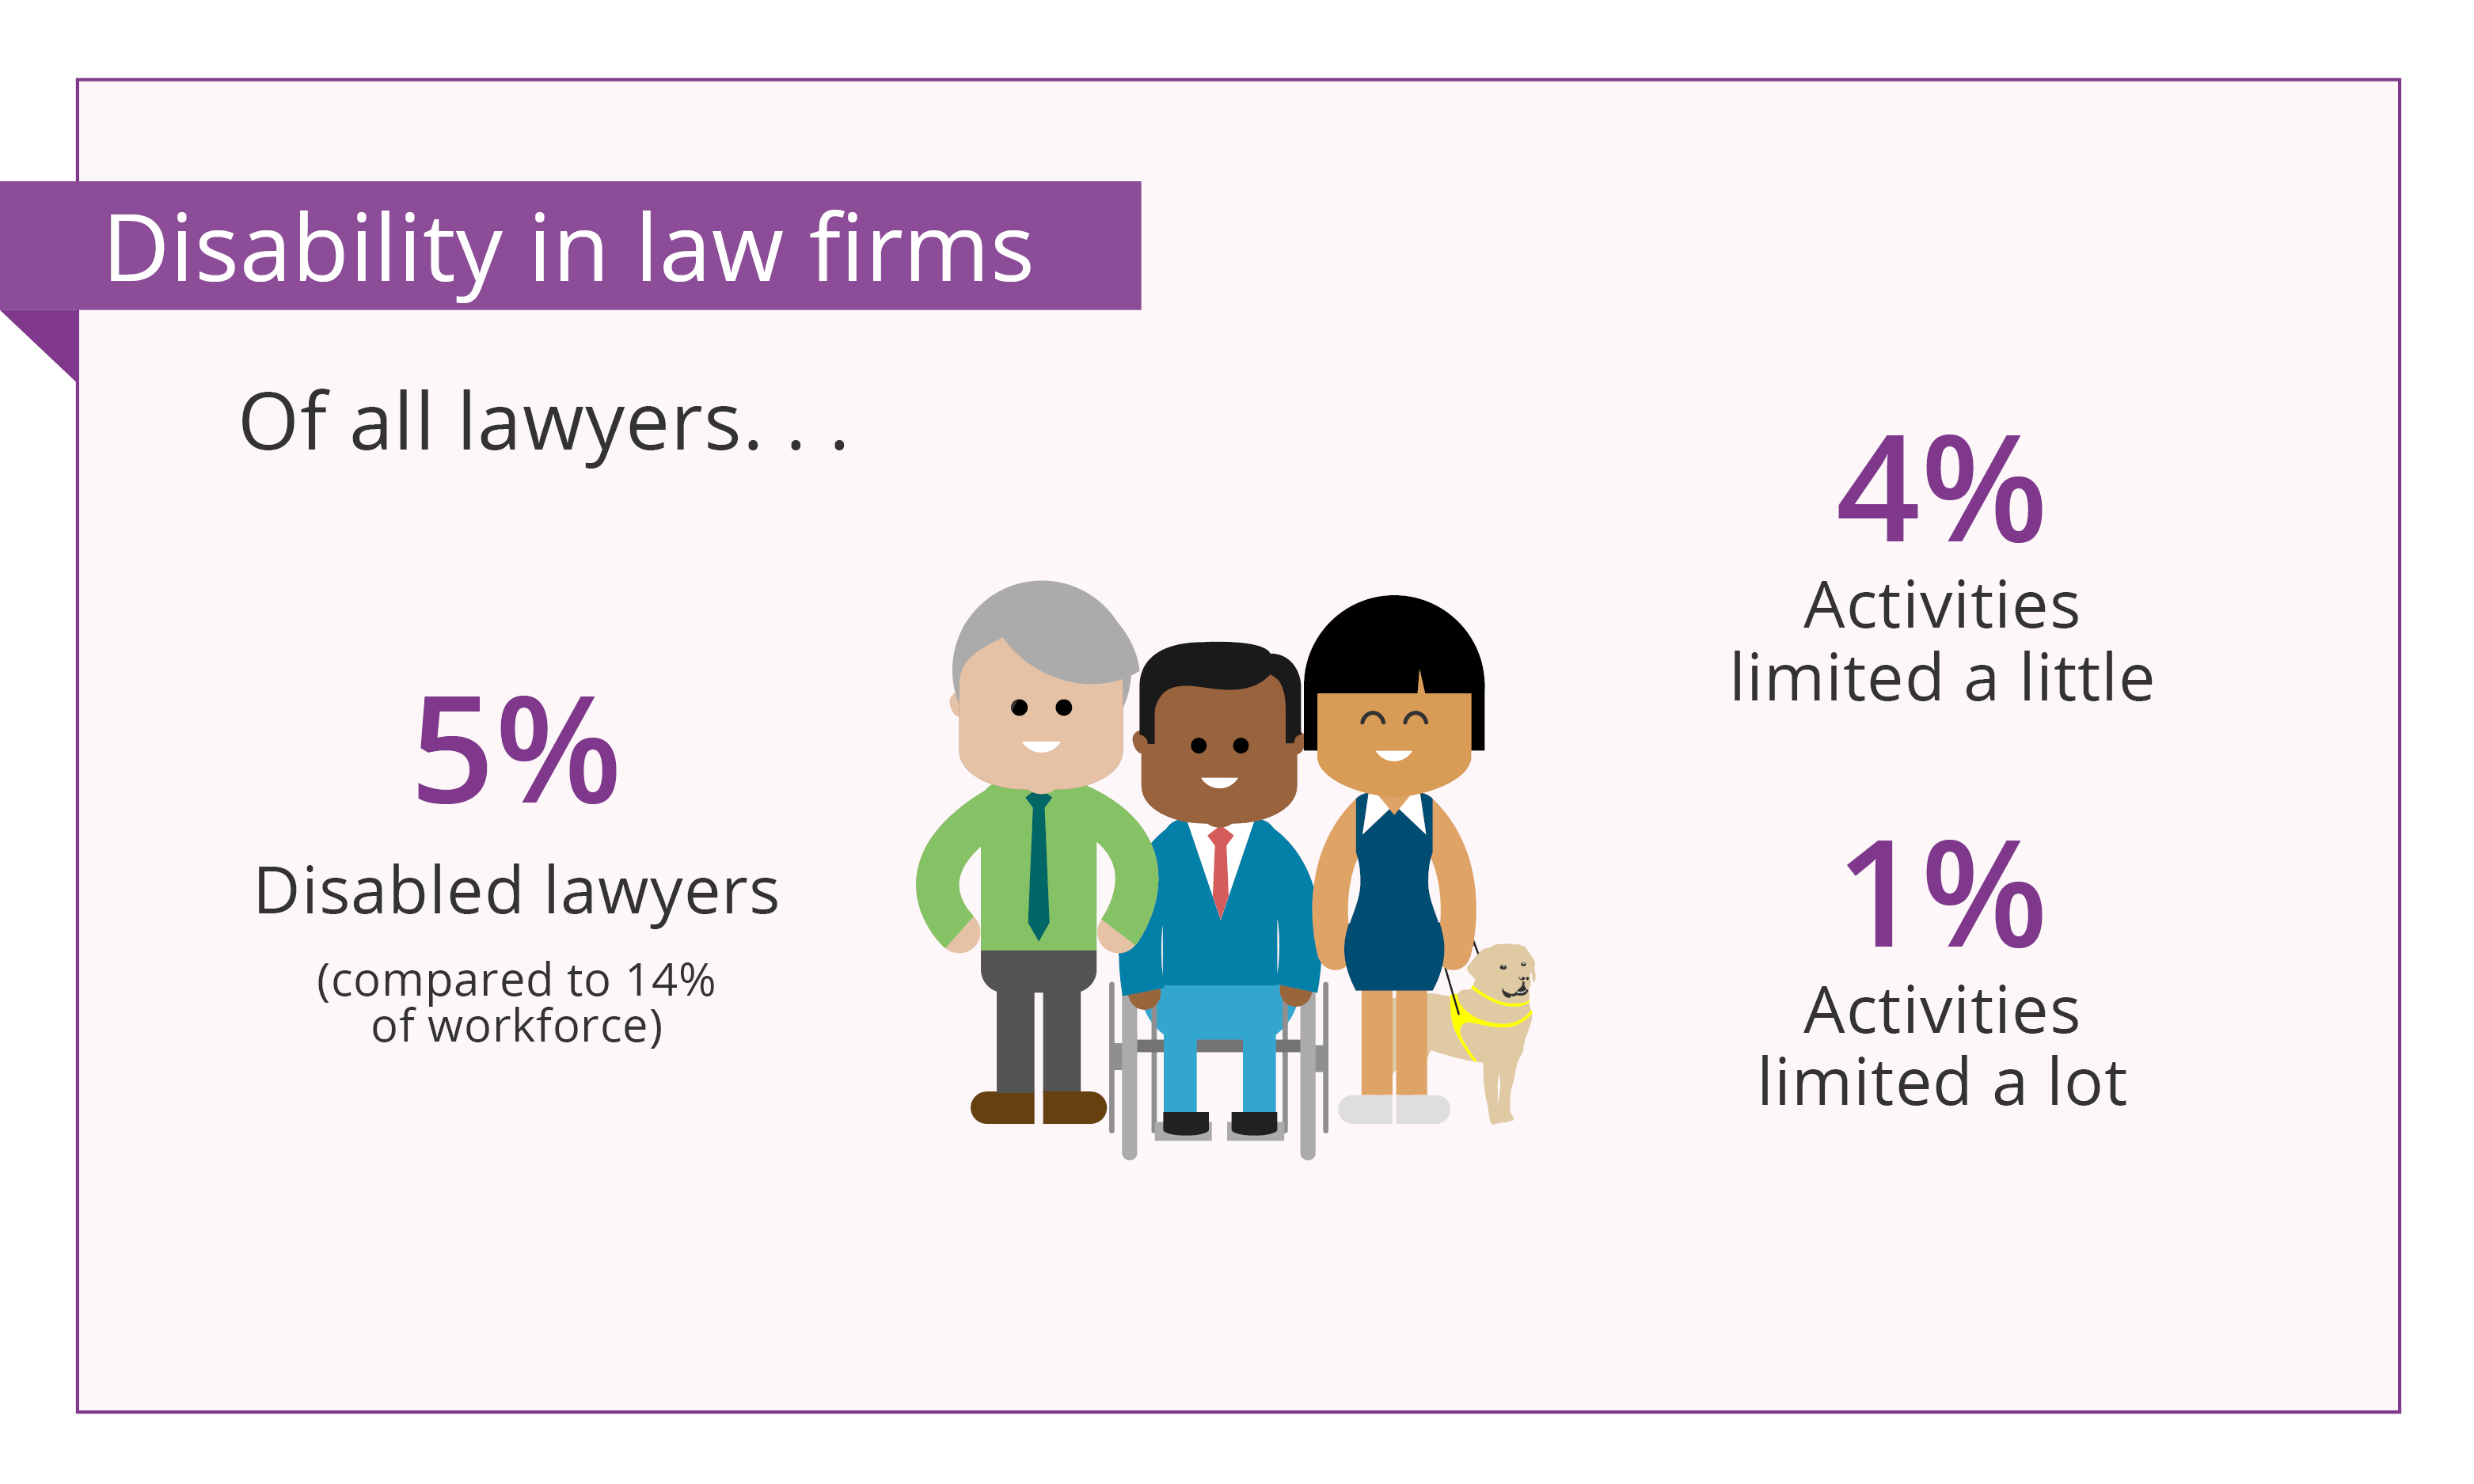
5% of lawyers declared they are disabled and although this has increased from 4% in 2019, it is still significantly lower than the UK workforce where in 2021, 14% of the workforce declared a disability and 20% of the working age population.
4% of lawyers preferred not to declare whether they had a disability or not, this has increased slightly although with rounding it shows the same as in 2019 in the data tool.
6% of lawyers declared that their day-to-day activities were limited by a health condition or disability compared to 5% in 2019. 1% were affected a lot and 4% a little in 2021 (this totals 6% because of rounding).
By seniority
There is a slightly higher proportion of disabled solicitors than disabled partners:
- 5% of solicitors declared a disability and 6% declared that their day-to-day activities were limited by a health condition or disability (1% were affected a lot and 5% a little)
- 4% of partners declared a disability and 5% declared that their day-to-day activities were limited by a health condition or disability (1% were affected a lot and 4% a little).
By firm size
Although there is no significant difference in the proportion of disabled lawyers in smaller firms, there are some differences in larger firms:
- 10 to 50 partner firms have a higher proportion of disabled lawyers at 6% – up from 4% in 2019
- 50+ partner firms have a lower proportion of disabled lawyers at 4% – up from 3% in 2019.
By work type
There are some differences by type of legal work:
- a smaller proportion of disabled lawyers work in firms mainly doing corporate work at 3% (up from 2% in 2019) and property at 4% (up from 3% in 2019)
- all other work areas show disabled lawyers at 5%.
Other staff
For other staff working in law firms, 5% are disabled and 3% preferred not to declare, with no changes for either category since 2019. 6% of other staff declared that their day-to-day activities were limited by a health condition or disability with no change from 2019 (1% were affected a lot and 5% a little in 2021).
The Social Mobility Commission identifies parental occupation as the most reliable indicator of socio-economic status. We have reported parental occupation in accordance with the national approach, using three categories for socio-economic background: professional (or higher socio-economic background), intermediate and working class (or lower socio-economic background).
- The professional socio-economic category is made up of modern and traditional professional occupations and senior, middle or junior managers or administrators
- The intermediate socio-economic category is made up of clerical and intermediate occupations and small business owners who employee less than 25 people
- The lower socio-economic category is made up of technical and craft occupations and long-term unemployed.
In carrying out the analysis of data for parental occupation, we have used the national and industry level data sets. Read more about measuring socio-economic diversity.
We changed the wording of the parental occupation question in 2021 (to align with guidance from the Social Mobility Commission) which means we are not able to compare the data with previous years. Although we asked about parental qualification, it is not regarded as the most reliable indicator of social mobility - the data is available in the firm diversity data reporting tool, but we have not drawn out the key findings here.
All lawyers
Parental occupation - there is a greater proportion of lawyers from a professional background compared to the general population and legal sector.
- 58% of lawyers are from a professional background, compared to 37% nationally and 59% in the legal sector
- 12% of lawyers are from an intermediate background, compared to 24% nationally and 18% of the legal sector
- 17% of lawyers are from a lower socio-economic background, compared to 39% nationally and 23% of the legal sector.
3% selected other responses (such retired or do not know) and 9% of lawyers preferred not to declare their parental occupation.
(NB We include the other category and those who prefer not to say in calculating the percentage figures for lawyers. The national figures are calculated by excluding these groups. Using the national approach the breakdown for lawyers is 66% professional, 14% intermediate and 20% lower socio-economic background).
School attended - there is a greater proportion of lawyers who attended an independent/fee paying school than nationally:
- 22% of lawyers attended an independent/fee-paying school (no change since 2019), compared to a national average of 7.5% of the workforce attending an independent/fee-paying school. 20% had no bursary and 3% received a bursary covering 90% or more of the fees (the numbers do not add up to 22% because of rounding)
- 63% of lawyers attended a state school (up from 62% in 2019) with 20% attending selective state schools.
- 8% attended schools outside the UK (down from 10% in 2019).
Looking at the ratio of those attended independent/fee-paying schools and state schools, we can see there has been very little change since 2019:
- for every lawyer from a fee-paying school in 2021, there were 2.82 lawyers who attended a state school, a slight increase from 2.79 in 2019
- for every partner from a fee-paying school in 2021, there were 2.35 partners who attended a state school, a slight increase from 2.32 in 2019
- for every solicitor from a fee-paying school in 2021, there were 3.17 solicitors who attended a state school, a slight increase from 3.15 in 2019.
6% of lawyers preferred not to declare their school type.
By seniority
Parental occupation - there is little difference in the socio-economic background of partners and solicitors:
- 58% of partners are from a professional background, compared to 58% solicitors
- 12% of partners are from an intermediate background, compared to 12% solicitors
- 16% of partners are from a lower socio-economic background, compared to 18% solicitors.
11% of partners preferred not to declare their parental occupation, compared to 8% of solicitors.
School attended - a greater proportion of partners attended an independent/fee-paying school compared to solicitors:
- 26% of partners attended an independent/fee-paying school (up from 25% in 2019), compared to 20% of solicitors (no change since 2019)
- 60% of partners attended a state school (up from 58% in 2019), compared to 65% of solicitors (up from 64% in 2019)
- 7% of partners attended school outside the UK (down from 9% in 2019), compared to 9% of solicitors (down from 10% in 2019).
7% of partners preferred not to declare their school type, compared to 5% of solicitors.
By firm size
Parental occupation - there is a greater proportion of lawyers with a parent from a professional background in larger firms:
- 68% of lawyers in firms with 50+ partners are from a professional background, compared to 48% in one partner firms
- 8% of lawyers in firms with 50+ partners are from an intermediate background, compared to 14% in one partner firms
- 14% of lawyers in firms with 50+ partners are from a lower socio-economic background, compared to 17% in one partner firms.
19% of lawyers in one-partner firms preferred not to declare their parental occupation, compared to 5% in 50+ partner firms.
School attended - there is a greater proportion of lawyers who attended an independent/fee-paying school in larger firms:
- 29% of lawyers in firms with 50+ partners attended an independent/fee-paying school (down from 31% in 2019), compared to 16% in one-partner firms (up from 15% in 2019)
- 55% of lawyers in firms with 50+ partners attended a state school (up from 54% since 2019), compared to 60% in one-partner firms (up from 57% in 2019)
- 11% of lawyers in firms with 50+ partners attended school outside the UK (down from 12% in 2019), compared to 11% in one-partner firms (down from 14% in 2019).
4% of lawyers in firms with 50+ partners preferred not to declare their school type, compared to 12% of lawyers in one-partner firms.
By work type
Parental occupation - there are differences in socio-economic background by work type with a greater proportion of lawyers from a professional background working in firms which mainly do corporate work:
- 71% of lawyers in firms which mainly do corporate work are from a professional background compared to 42% in firms mainly doing criminal work
- 21% of lawyers in firms which mainly do criminal work are from a lower socio-economic background compared to 11% in firms which mainly do corporate work.
5% of lawyers in firms which mainly do corporate work preferred not to declare their parental occupation, compared to 22% in firms which mainly do criminal work.
School attended - there is a greater proportion of lawyers in firms which mainly do corporate work who attended an independent/fee paying school:
- 45% of lawyers in firms which mainly do corporate work attended a state school (up from 42% in 2019,) compared to 70% lawyers in firms which mainly do criminal work (up from 68% in 2019)
- 18% of lawyers in firms which mainly do corporate work attended school outside the UK (down from 22% in 2019,) compared to 3% lawyers in firms which mainly do criminal work (down from 5% in 2019).
3% of lawyers in firms which mainly do corporate work preferred not to declare their school type compared to 13% in firms which mainly do criminal work.
Other staff
Parental occupation - for other staff working in law firms, there is a closer correlation with the national data and FPS sector than there is with the breakdown for lawyers:
- 42% are from a professional background, compared to 37% nationally and 49% in the FPS sector
- 13% are from an intermediate background, compared to 24% nationally and 22% from the FPS sector
- 31% are from a lower socio-economic background, compared to 39% nationally and 29% in the FPS sector.
9% of other staff preferred not to declare their parental occupation.
School attended - for other staff working in law firms, there is a closer correlation with the general public than there is with the breakdown for lawyers:
- 8% of other staff attended a fee-paying school (up from 7% in 2019), compared to 7.5% in the wider population
- 80% of other staff attended a state school (no change since 2019)
- 7% of other staff attended a school outside the UK (down from 8% in 2019).
5% of other staff preferred not to declare their school type.
All lawyers
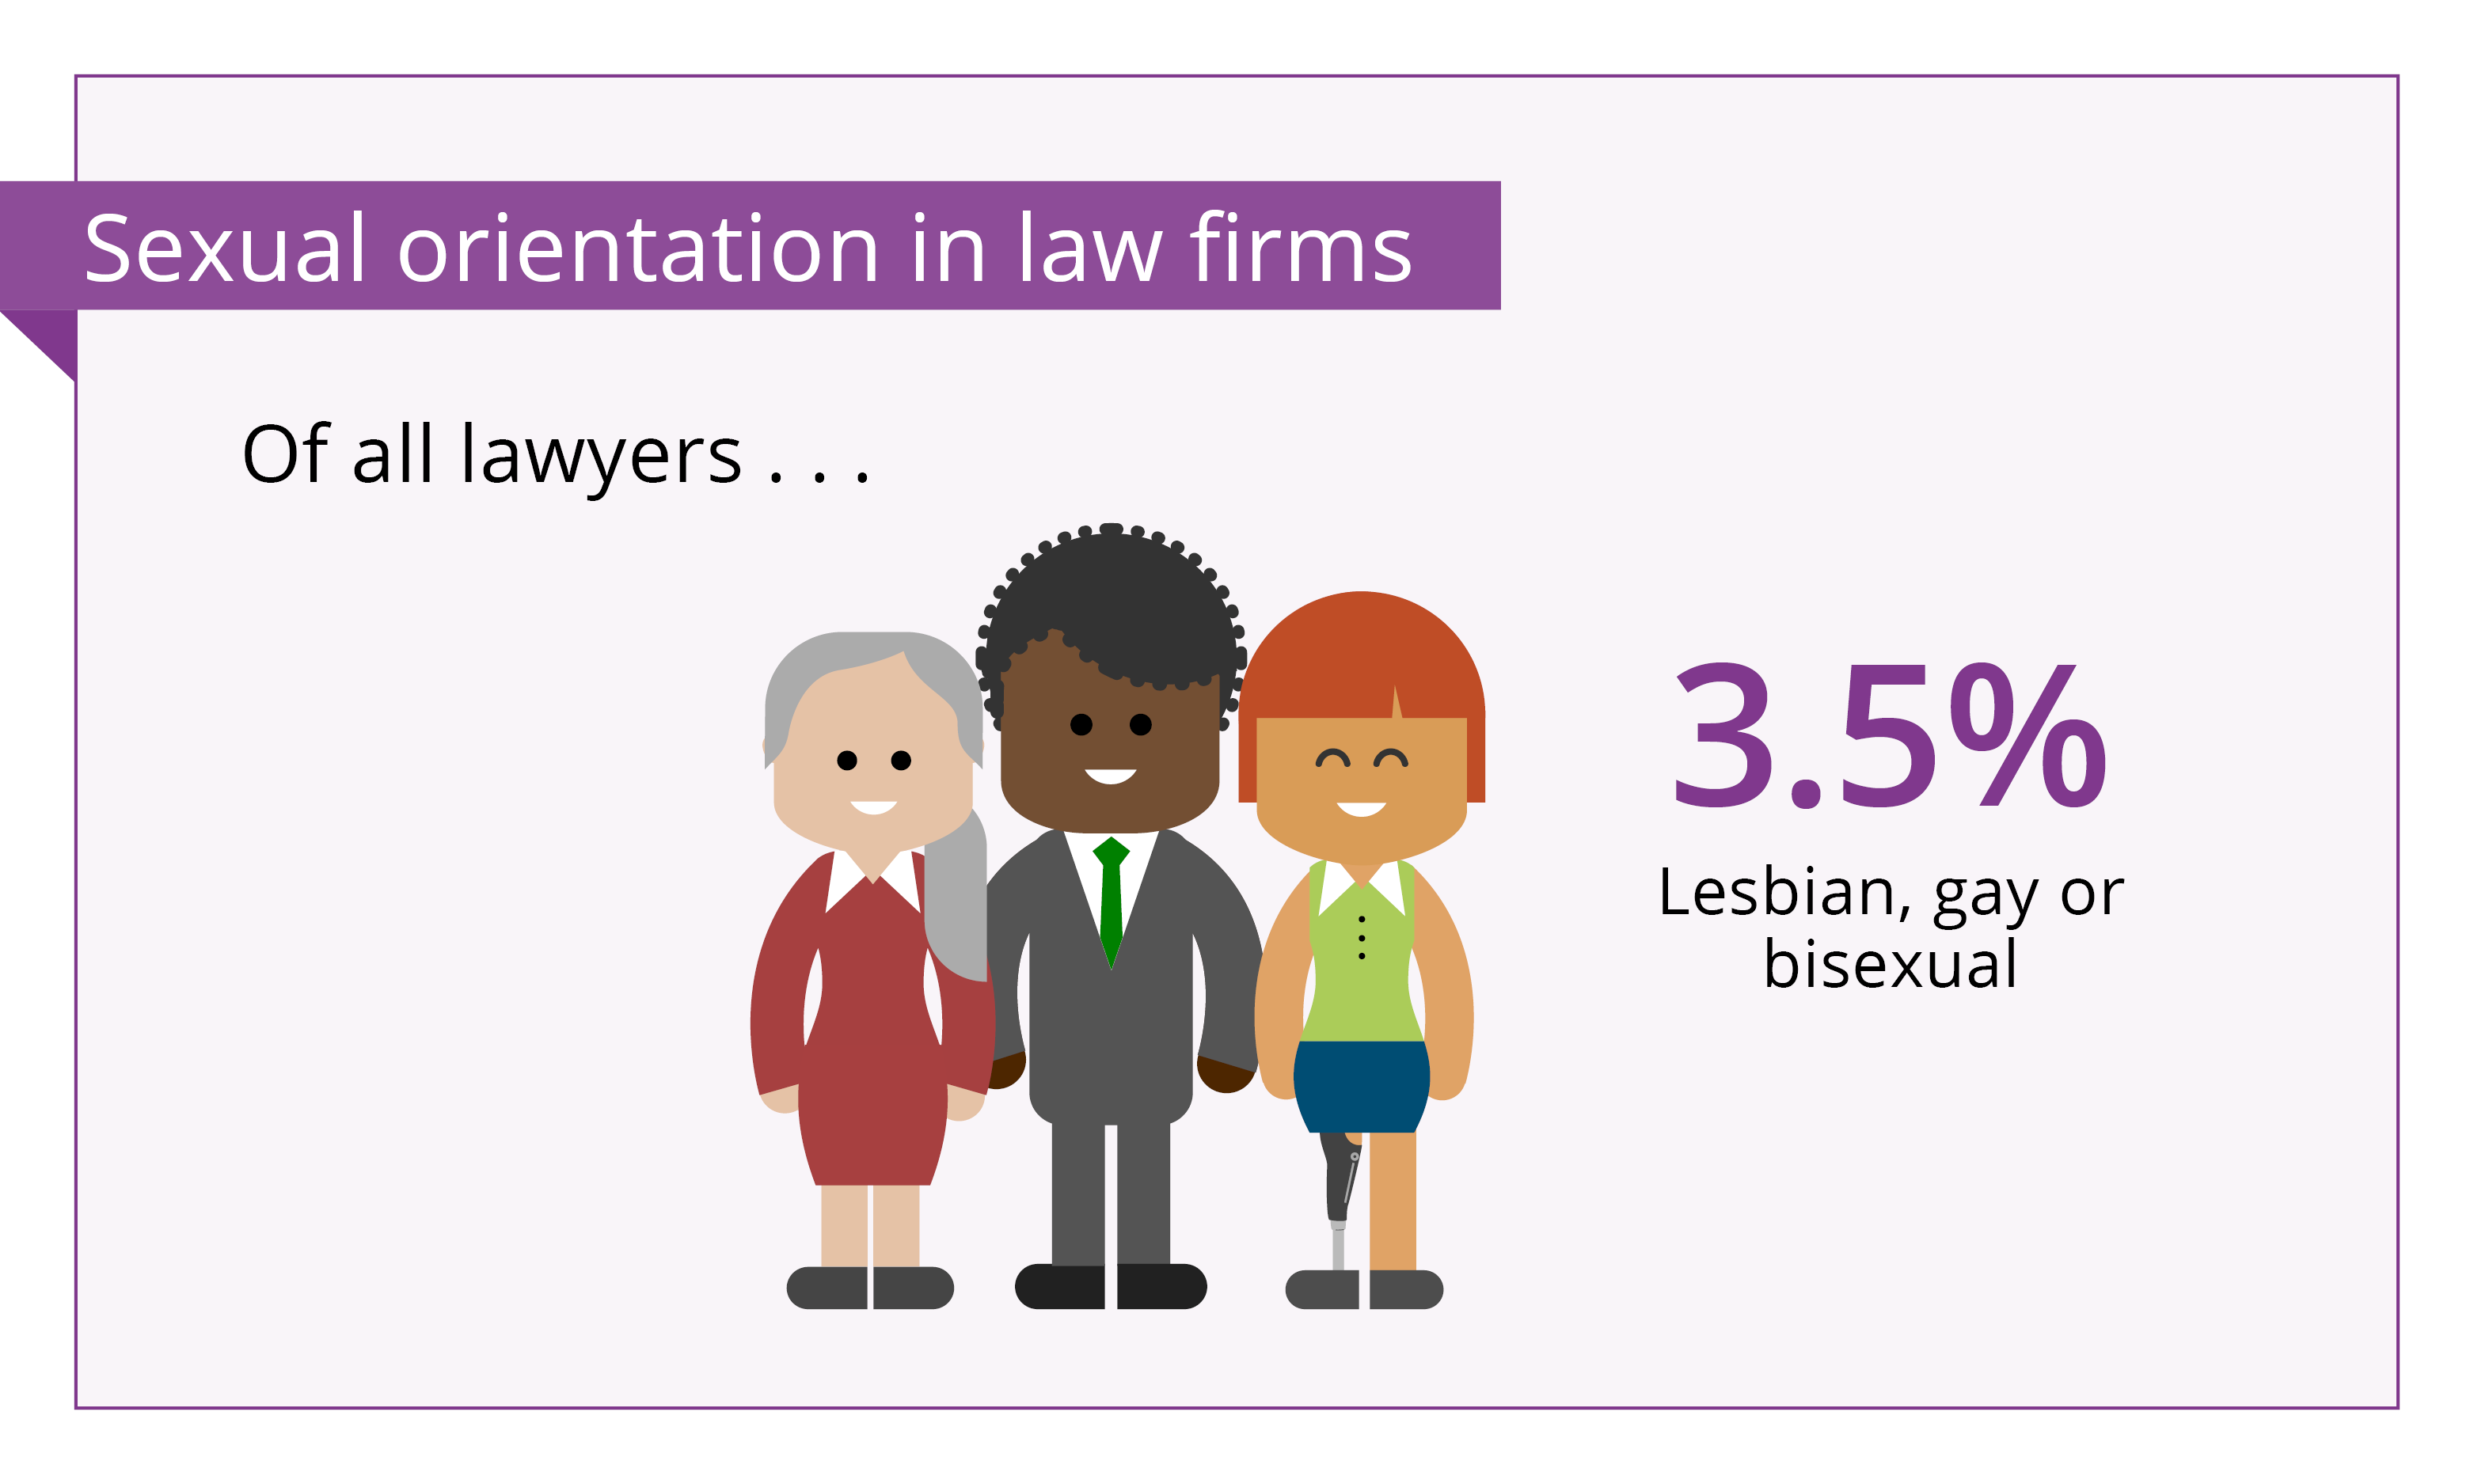
There is a greater proportion of lawyers who identify as Lesbian, Gay or Bi (LGB) compared to the UK population (because of the small numbers and to allow closer comparison with national data we have provided the percentages rounded to one decimal point):
- 89.3% of lawyers identify as heterosexual, compared to 93.7% of the UK population – down from 89.7% in 2019 for lawyers
- 3.5% of lawyers identify as LGB (of whom 2.5% are Lesbian or Gay and 1.0% are Bi), compared to 3% of the UK population (of whom 1.6% are Lesbian or Gay, and 1.1% are Bi) – up from 3.1% in 2019 for LGB lawyers
- 0.3% of lawyers prefer another description, compared to 0.7% of the UK population – up from 0.2% in 2019 for lawyers.
6.9% of lawyers prefer not to declare their sexual orientation down from 7.0% in 2019.
By seniority
There is a higher proportion of solicitors who identify as LGB than partners and a higher declaration rate for solicitors:
- 4.0% of solicitors are LGB (1.3% Bi, 2.7% Lesbian or Gay) up from 3.4 in 2019 and 6.1% prefer not to declare their sexual orientation (down from 6.2% in 2019)
- 2.8% of partners are LGB (0.6% Bi, 2.2% Lesbian or Gay), up from 2.6% in 2019 and 8.2% prefer not to declare their sexual orientation (down from 8.4% in 2019).
By firm size
Although the numbers are small, there are some variations when we look at the data by firm size as there is a lower proportion lawyers who identify as LGB in smaller firms:
- 4.4% of lawyers in the largest firms with 50+ partners (up from 4% in 2019)
- 4.3% of lawyers in firms with 10 to 50 partners (up from 4% in 2019)
- 3.2% of lawyers in firms with 6 to 9 partners (up from 2.9% in 2019)
- 2.4% of lawyers in firms with 2 to 5 partners (up from 2.2% in 2019)
- 2.3% of lawyers in one-partner firms (up from 1.8% in 2019).
By work type
There is a larger proportion of lawyers who identify as LGB in firms which mainly do corporate work (5.6%) and other work (6.1%).
Other staff
For other staff working in law firms, 4.1% identify as LGB (an increase from 3.5% in 2019) and 0.5% prefer another description (an increase from 0.4% in 2019).
5.7% of other staff prefer not to declare their sexual orientation, up from 5.2% in 2019.
All lawyers
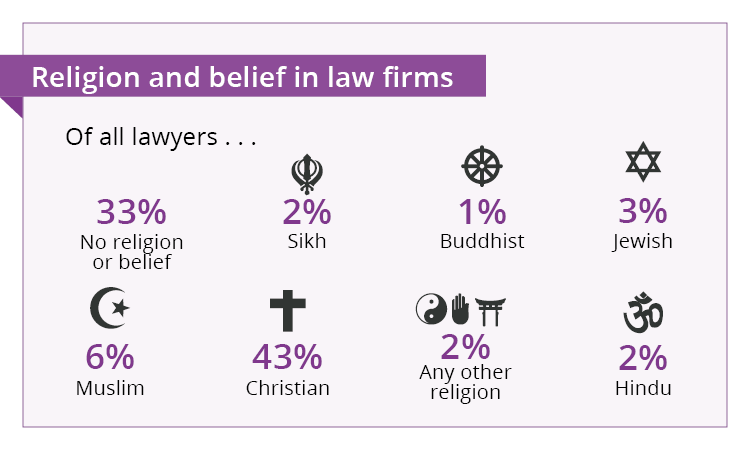
The largest group of lawyers is Christian followed by those who have no religion or belief, and the largest of the other faith groups is Muslim. 9% prefer not to declare their religion or belief, down from 10% in 2019:
- 43% of lawyers are Christian – down from 44% in 2019
- 33% of lawyers have no religion or belief – up from 31% in 2019
- 6% of lawyers are Muslim – up from 5% in 2019.
By seniority
There are some differences by seniority for the three largest groups with a slightly higher proportion of Christian and Muslim partners than solicitors, but a lower proportion of those with no religion or belief.
- 37% of solicitors have no religion or belief compared to 26% of partners
- 40% of solicitors are Christian compared to 48% of partners
- 6% of solicitors are Muslim compared to 6% of partners.
And 10% of partners prefer not to declare their religion, compared to 9% of solicitors.
By firm size
There are some differences by firm size for the three largest groups, with a greater proportion of Christians and those with no religion or belief in the largest firms compared to the smallest firms. The opposite is true for Muslims:
- 37% of lawyers in one-partner firms are Christian compared to 44% in firms with 50+ partners
- 20% of lawyers in one-partner firms have no religion or belief compared to 37% in firms with 50+ partners
- 16% of lawyers in one-partner firms are Muslim, compared to 2% of lawyers in firms with 50+ partners.
And 15% of lawyers in one-partner firms prefer not to declare their religion, compared to 8% in the firms with 50+ partners.
By work type
There are some differences for the three largest groups by work type for all lawyers:
- For corporate law, the largest faith group is Christian (40%), followed by Jewish and those who have another religion or belief, both at 3% and Muslim and Hindu groups both at 2%. The largest group among these firms is those who have no religion or belief, at 41%
- For criminal law, the largest faith group is Christian (33%), followed by Muslims at 13%, Sikhs at 4% and Hindus at 3%. 25% have no religion or belief.
Other staff
For other staff working in law firms:
- 40% have no religion or belief
- 40% are Christian
- 5% are Muslim
- 3% have another religion
- 2% are Hindu
- 1% are Buddhist
- 1% are Jewish
- 1% are Sikh.
And 8% of other staff prefer not to declare their religion, no change since 2019.
All lawyers
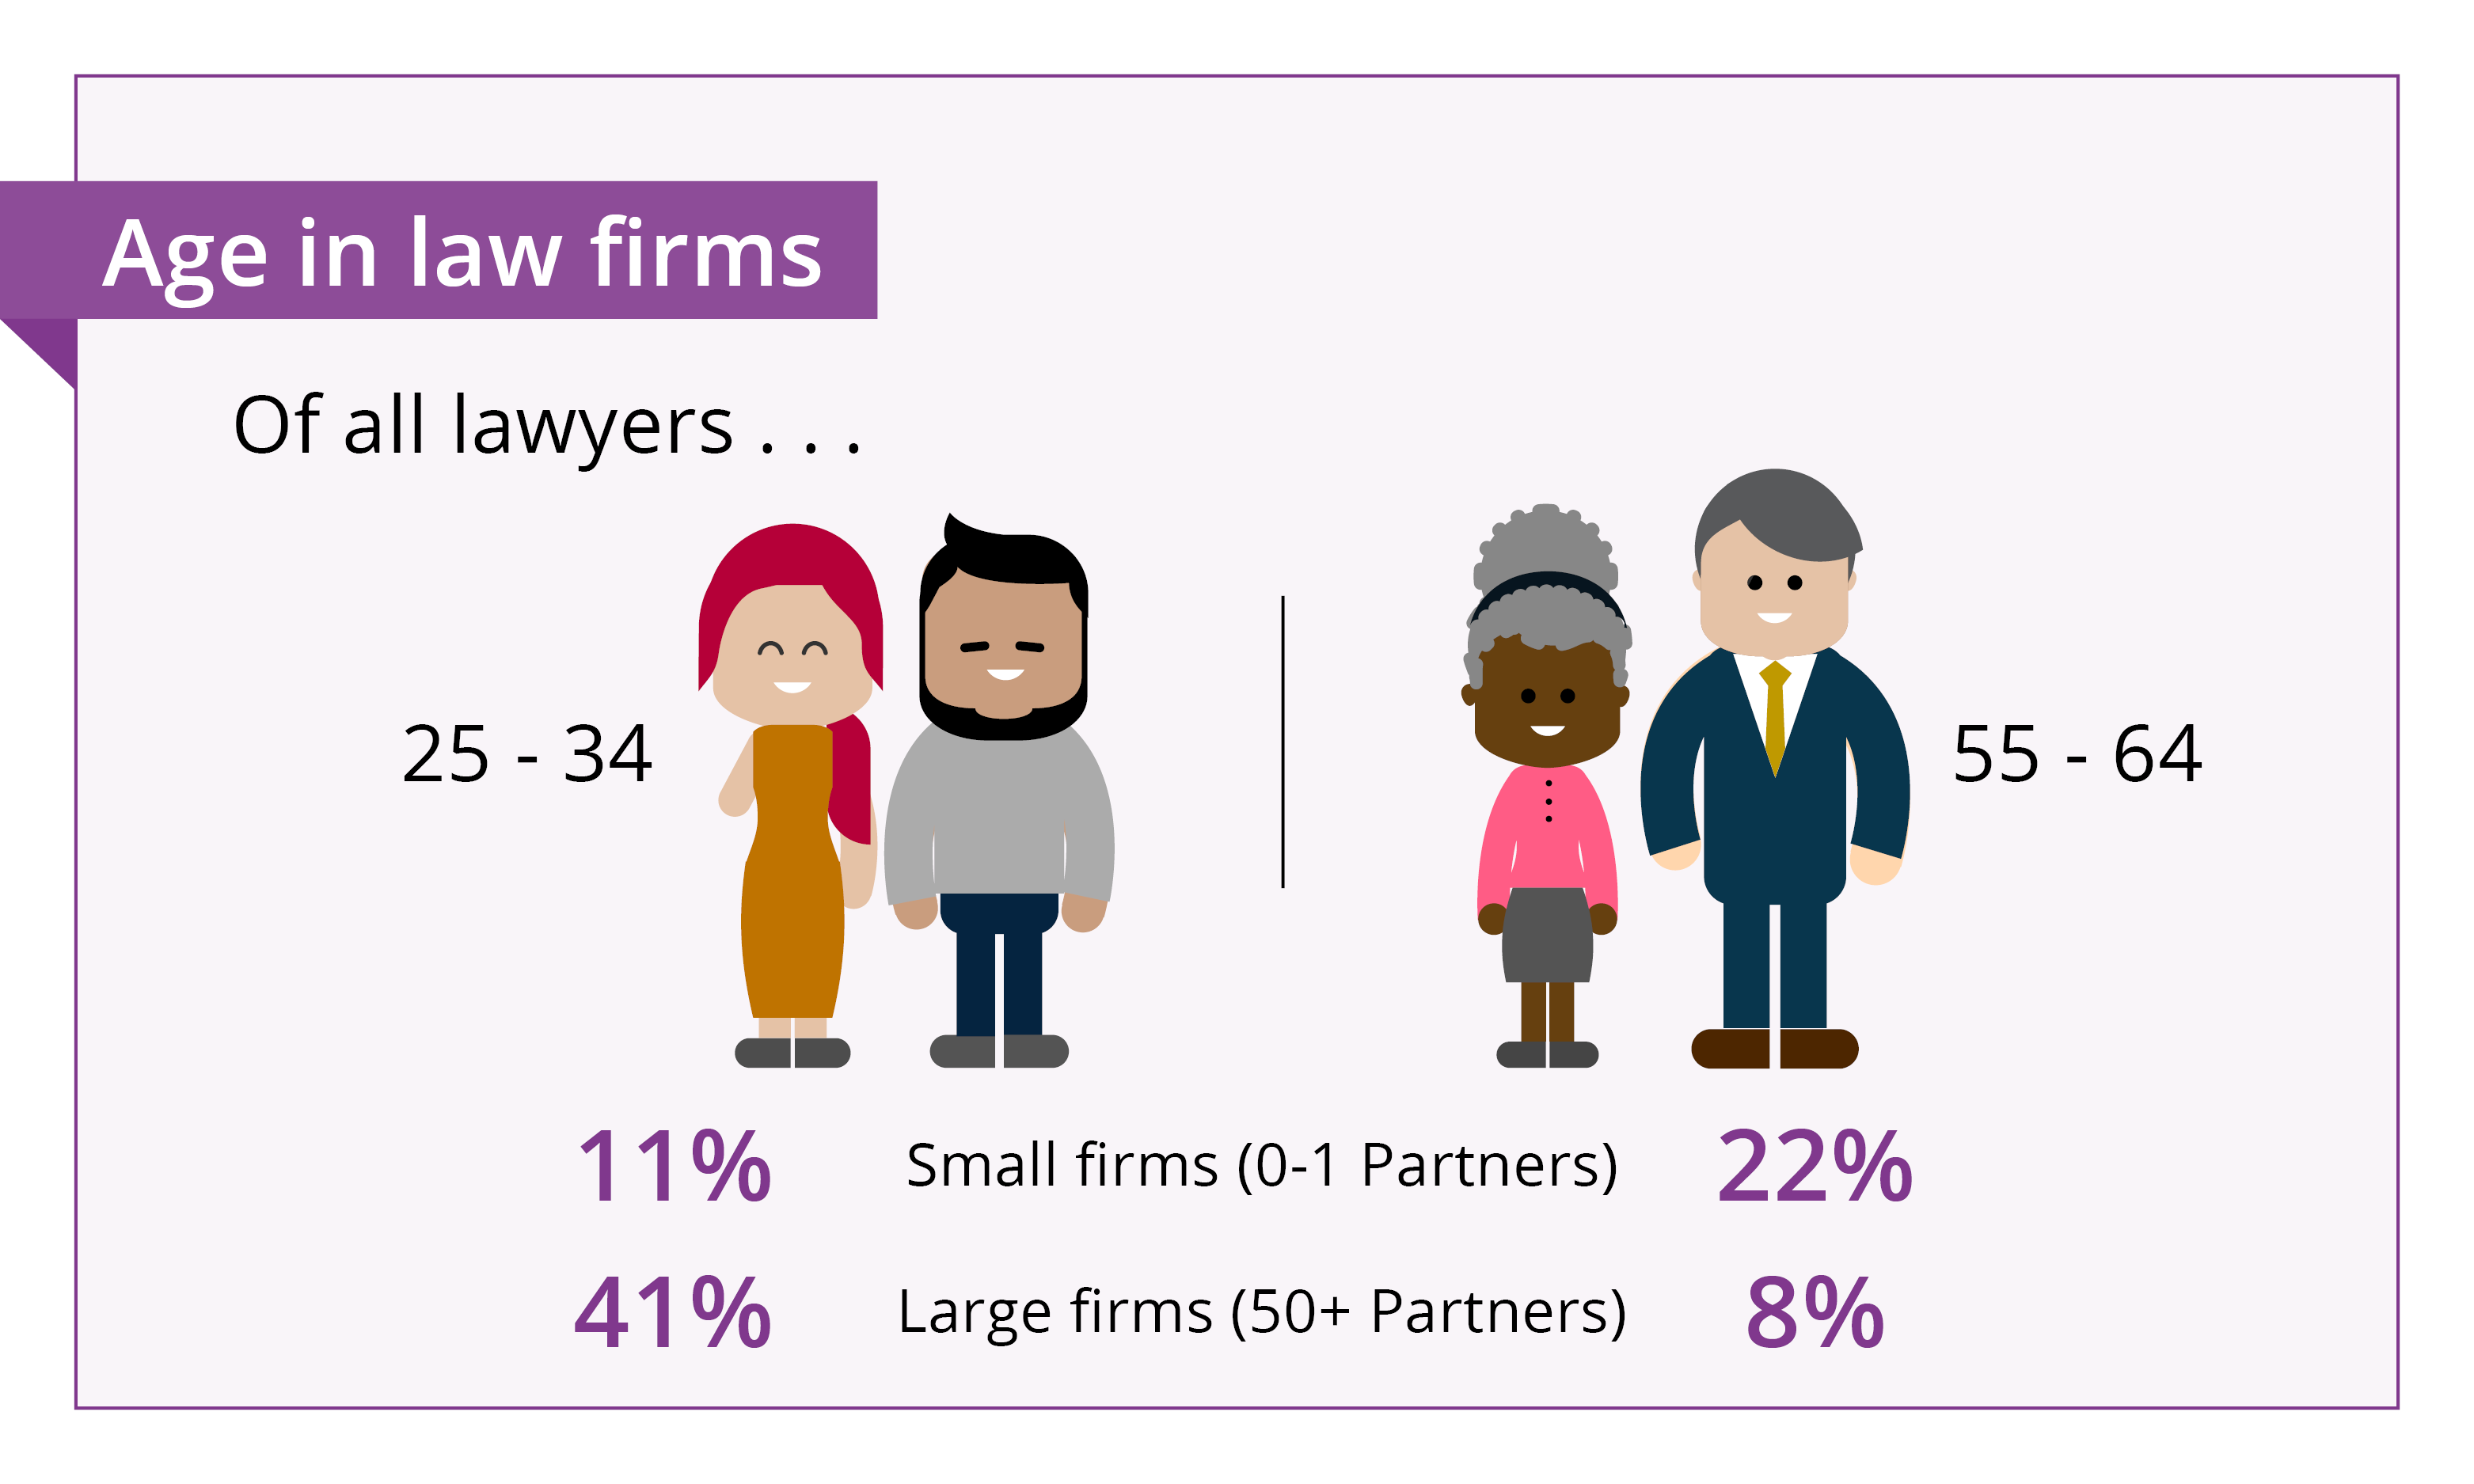
There is little change in the age profile of lawyers since 2019. More than half (59%) of lawyers are aged 25-44:
- 29% are aged 25-34 – down from 31% in 2019
- 29% are aged 35-44 – no change since 2019
- 22% are aged 45-54 – no change since 2019
- 13% are aged 55-64 – up from 12% in 2019
- 4% are 65+ – no change since 2019.
2% of lawyers preferred not to declare their age, no change since 2019.
By seniority
The data reflects the average career pattern of solicitors and when they might expect to become partners in a firm:
- For partners, the largest age group is 45-54 (36%) followed by 35-44 (29%) and then 55-64 (22%).
- For solicitors, the largest age group is 25-34 (44%) followed by 35-44 (29%) and then 45 to 54 (14%).
By firm size
The age group of partners vary depending on the firm size, with a greater proportion of older partners in smaller firms:
- 47% of lawyers who are 25-34 work in law firms which mainly do corporate work, compared to firms mainly doing criminal (12%) or private client (17%) work
- 7% of lawyers who are 55-64 work in law firms which mainly do corporate work, compared to firms mainly doing criminal work or private client (both 19%).
5% of partners in one-partner firms preferred not to declare their age compared to 0.3% in 50+ partner firms.
By work type
There are some differences in the age categories, depending on the type of legal work:
- 47% of lawyers who are 25-34 work in law firms which mainly do corporate work, compared to 12% in firms mainly doing criminal or private client (17%) work
- 7% of lawyers who are 55-64 work in law firms which mainly do corporate work, compared to 19% who work in law firms mainly doing criminal work or private client (both 19%).
Other staff
For other staff working in law firms, the largest age group for other staff, is 25-34 (29%) and this is true for all firm sizes.
All lawyers
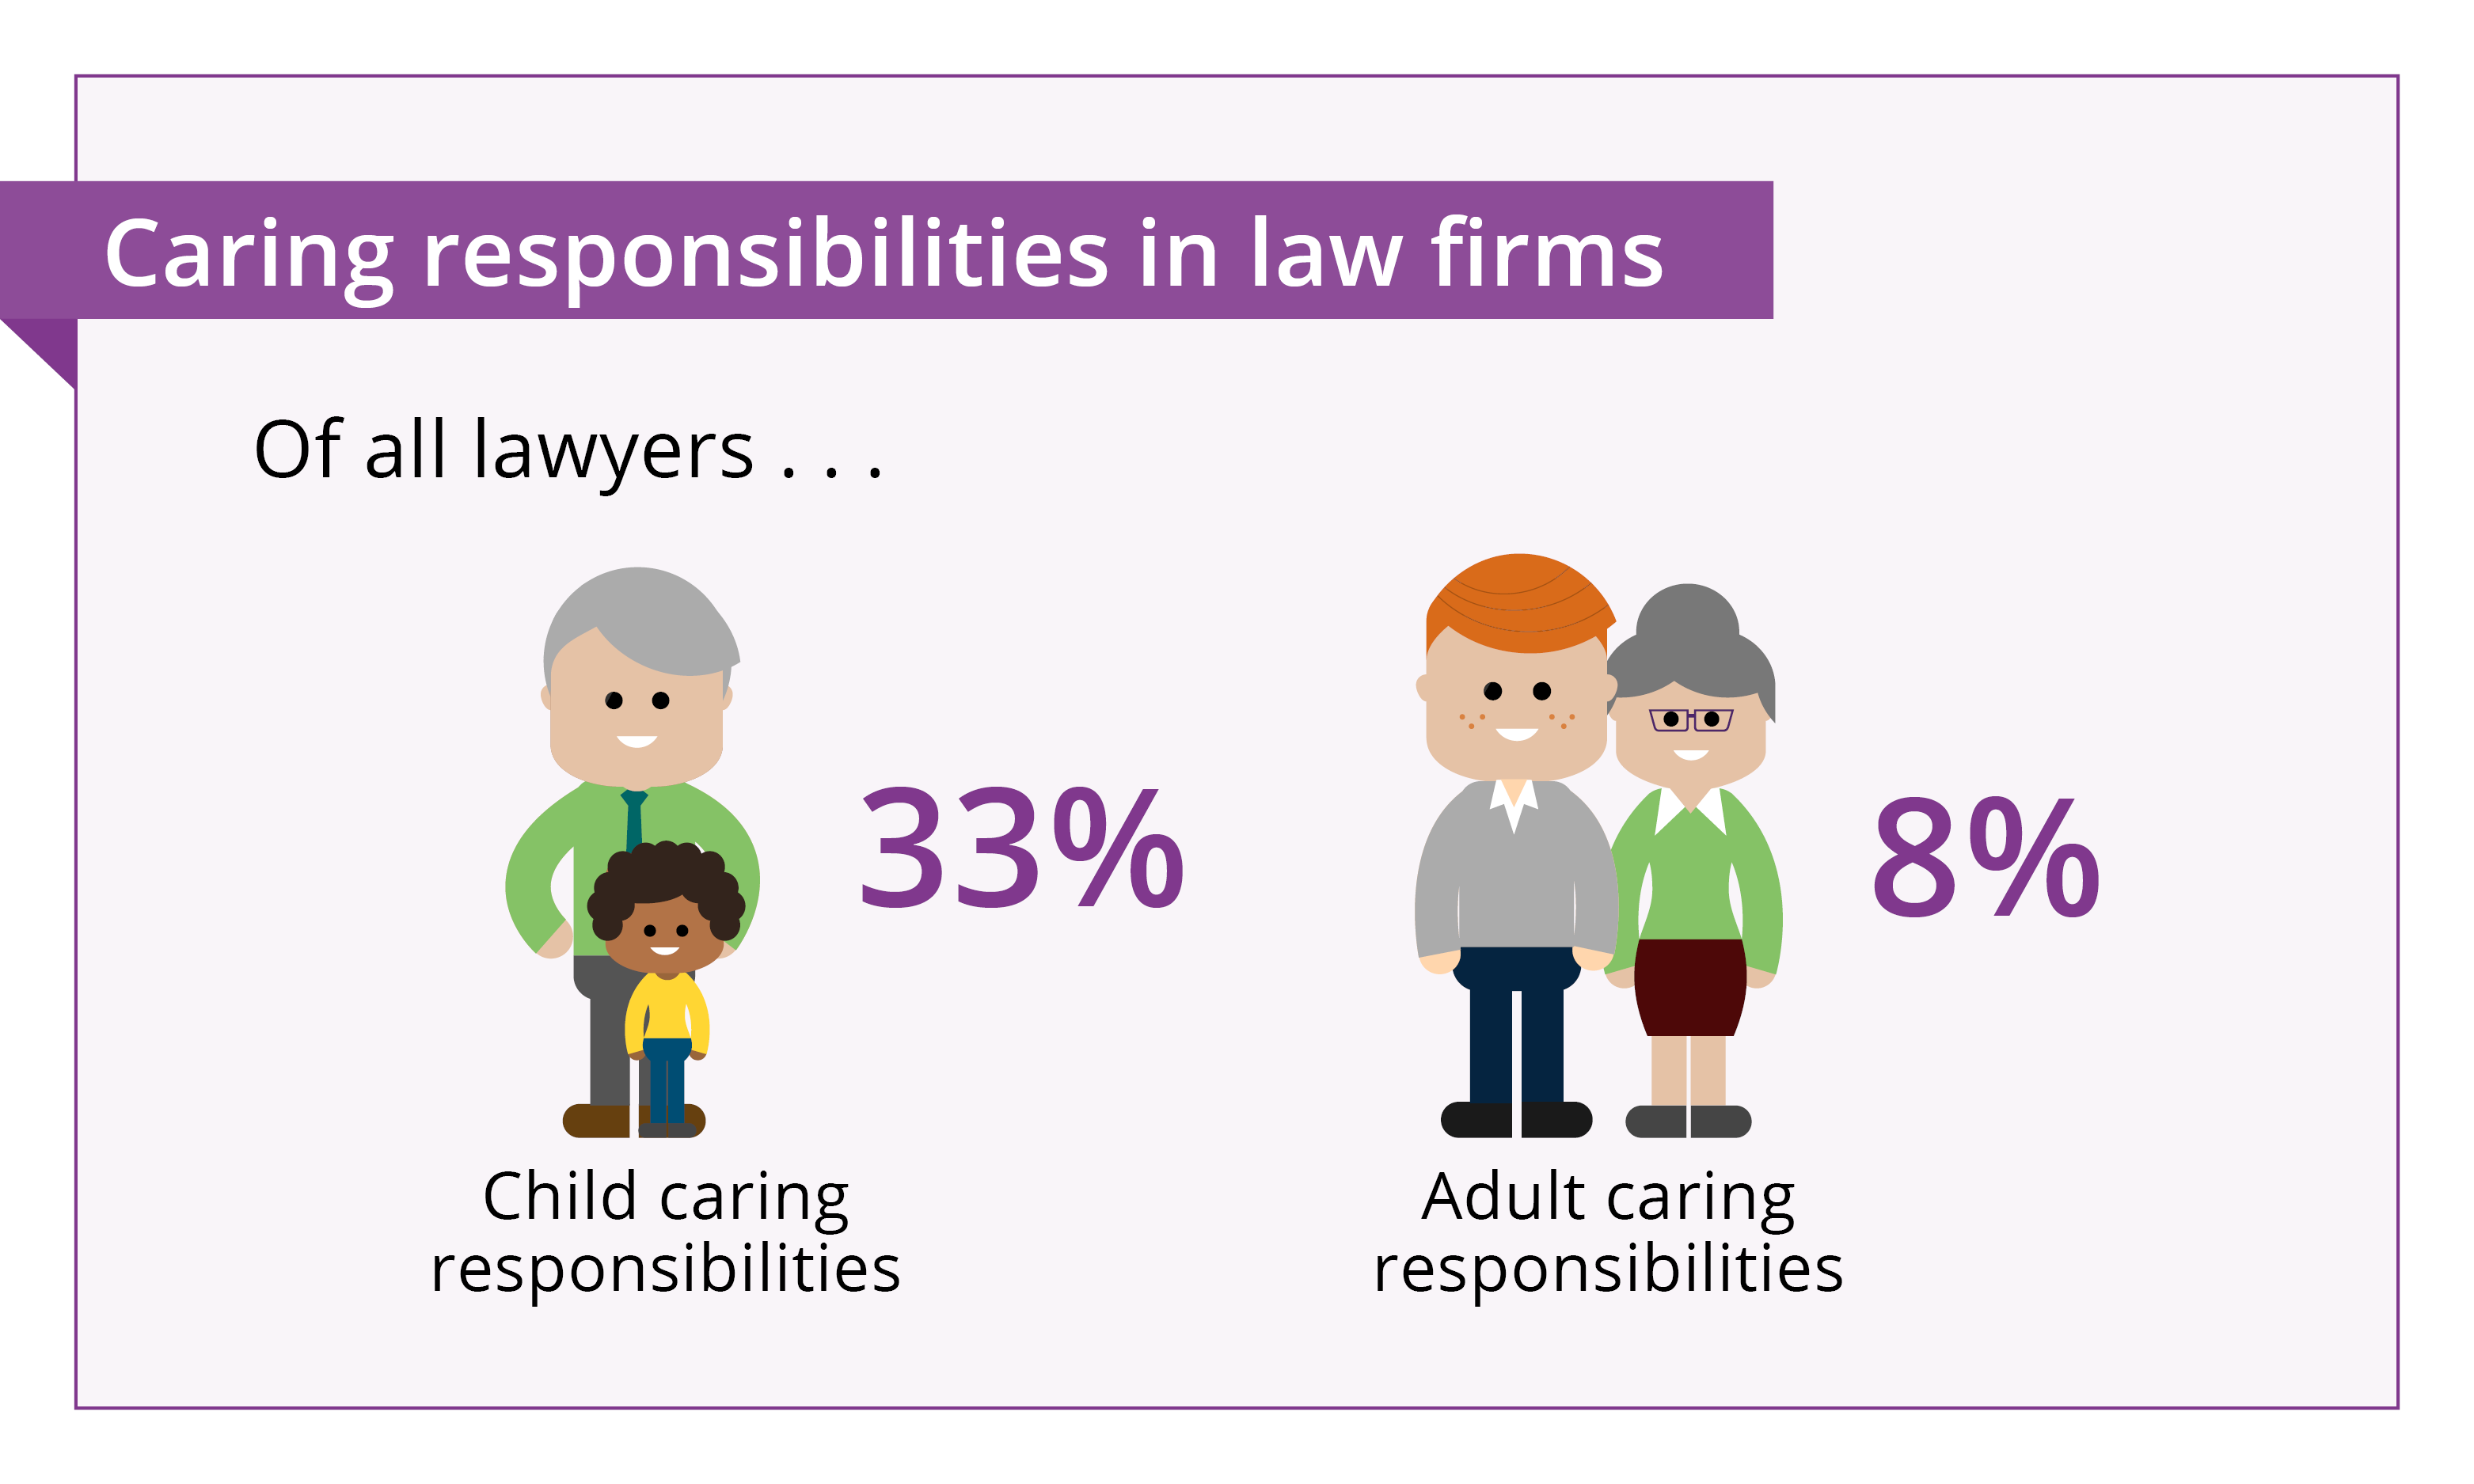
A third of lawyers have primary caring responsibilities for children (33%), up from 32% in 2019 and 8% care for others with long term physical or mental ill health cause by disability or age, up from 7% in 2019.
The proportion of lawyers who preferred not to declare their childcare responsibilities is 5% (no change since 2019) and their other care responsibilities is 6% (no change since 2019).
By seniority
The proportion of those with caring responsibilities is slightly higher for partners than solicitors. 38% of partners care for children (up from 36% in 2019) and 10% for others (up from 9% in 2019), compared to 31% of solicitors caring for children (up from 30% in 2019) and 7% caring for others (up from 6% in 2019).
By firm size
There are some differences by firm size:
- There is a higher proportion of lawyers caring for children in the mid-sized firms, with 36% of those in firms with 6 to 9 and 37% in 10 to 50 partners, compared to 29% in one partner firms and 32% in 50+ partner firms
- There is a higher proportion of lawyers caring for others in one-partner firms at 10%, with 8% in 2 to 5 partner firms, 9% in 6 to 9 partner firms, 7% in 10 to 50 partner firms and 7% in 50+ partners firms
By work type
There are differences when we look at the type of legal work undertaken by lawyers with caring responsibilities:
- 38% of lawyers working in firms which mainly do litigation work are caring for children, compared to 31% of those doing criminal work and 28% of those doing corporate work
- 5% of lawyers working in firms which mainly do corporate work are caring for others, compared to 10% of those doing criminal work
Other staff
For other staff working in law firms, 24% are caring for children and 9% for others.
We have provided an overview of diversity in law firms in Wales for sex, ethnicity and disability, based on all lawyers working in law firms whose head office is based in Wales. The data for Wales can be seen in the diversity data tool, and we have compared this to the total of the English regions and national statistics for Wales.
Sex
Women make up 57% of lawyers in Wales, compared to 52% in England. Government employment figures for 2019 showed that women made up 48% of the workforce in Wales.
Ethnicity
The overall population of Black, Asian and minority ethnic lawyers working in law firms is 5% in Wales, compared to 18% in England. 92% of lawyers are White compared to 78% in England.
Government employment figures for 2019 showed that 5% of the workforce in Wales were from a Black, Asian or minority background and 95% were White.
- 2% of lawyers in Wales are Asian compared to 12% in England, with 3% of the workforce in Wales from an Asian background
- 1% of lawyers in Wales are Black compared to 2% in England with 1% of the workforce in Wales from a Black background
- 2% of lawyers in Wales are from a Mixed/Multiple background, compared to 3% in England, with 1% of the workforce in Wales are from a Mixed/Multiple background
- 0.21% of lawyers in Wales are from another ethnic background, compared to 1% in England.
3% of lawyers in Wales preferred not to declare their ethnicity compared to 4% in England.
Disability
6% of lawyers in Wales disclosed they had a disability, compared to 5% in England, and in Wales 22% of the population declared they had a disability.
In both England and Wales, 4% of lawyers preferred not to say.